This is one of the Goose/Gander Visualization Series.
Recently President Obama’s team has felt that attacking Romney’s jobs record in Massachusetts tests well in the sample group.
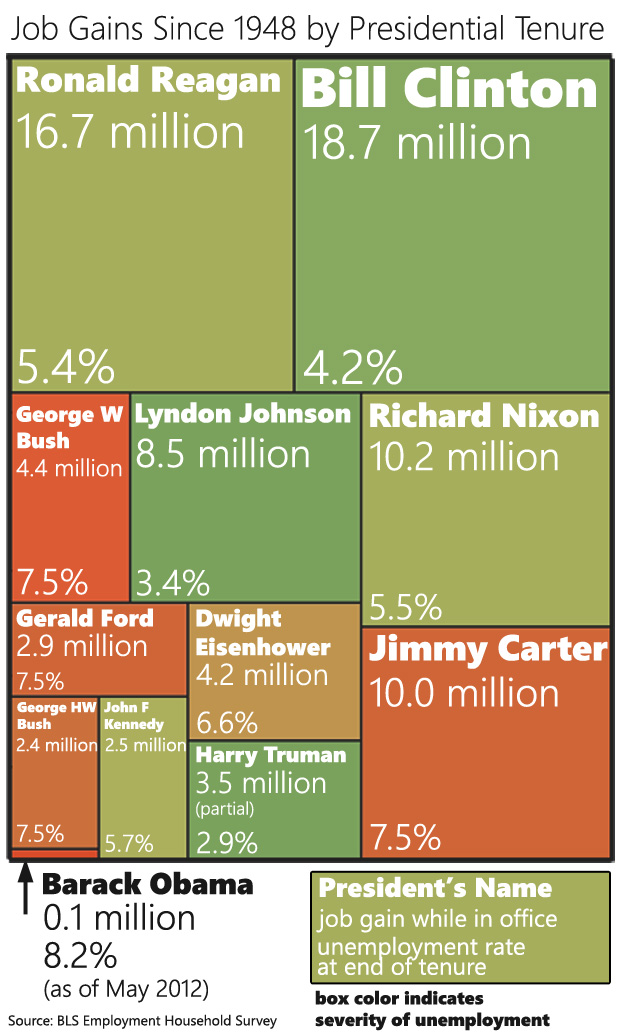
These attacks got me thinking about executive job records. “Where” I asked myself “would President Obama place in a ranking of US Presidents in terms of job creation?”

You can also download a larger version of the chart. I find it difficult to create visualizations that work well in both blog form and Facebook-sharing form. This was my attempt at a compromise.
Is this a fair comparison? Yes and no. Part of the Goose/Gander series is that I create a provocative visual and then explain in more details what is fair and isn’t fair about it.
This Isn’t Fair
President Obama hasn’t had a full term yet
This puts him at a distinct disadvantage to everyone else (except John F Kennedy) because he hasn’t had the same amount of time to grow jobs. However it also seems pretty obvious that he’s not going to get out of last place before January 2013. That would require 300K new jobs per month every month from now until then.
President Obama came into office in the middle of a recession
In fact, he came in the middle of a recession that was worse in terms of job loss than anything any other president in this chart had to deal with. Now, he did split those job losses about half-and-half with George W Bush, so it’s not as bad as it could have been for him.
Presidents only have a certain amount of control over job growth
Actually presidents (and executives in general) only have a certain amount of control over the economy, so this entire exercise is kind of tainted by that fact. But this is the part where we point out that Obama did start this by attacking Mitt Romney’s job record in a similar way.
This Is Fair
The data Is Unassailable
I’m using the Employment table from the BLS A Tables. This is not the one that most Obama proponents prefer to use. They prefer using the BLS B Tables because they give numbers that are kinder to Obama. But the B Tables undercount employment (they only count payrolls) and everyone knows this.
I counted January-January (or whenever the president left office) for each president. I did this not because it was particularly fair but because I wanted to match how Obama has assigned himself and Romney jobs responsibility. I’m following his lead to show that, if we take him at his word, he doesn’t stand up to his own standard.
If we’re going to play the presidential job visuals game…
… this is a totally fair visual to keep in mind. Depending on the metric, Obama talks about jobs in different ways. When talking raw numbers, he likes to talk about the “last 22 months” or however gets us to the low point in the recession. When talking about month-to-month change, he likes to talk about when he came into office which was the worst point of job loss in the recession, so everything else looks good in comparison.
Fairly or unfairly, Presidents and jobs are commonly linked. It’s only fair to give a proper representation of that information.
To be fair, though, that probably gave Ronnie more room to grow, starting from such a low point.
I Supported Clinton and Obama but now I know the republican candidate personally. I’m aware of his integrity and compassion first hand.
So I see all these deliberate lies and attacks (with the sterling exception of Clinton, who defended Mitt’s record), all these distortions, and I think: “I was wrong about many of these Democrats and what they stand for”.
Add to that the sore disappointment Obama has been. Tweak it all you want for accuracy, the graphic is clear: Obama has the worst jobs record of any president since WWII. And he thinks he’s one of the 4 greatest Presidents in History? He spends most of his time campaigning, fund-raising and playing golf! He’s our President in a time of crisis, worst unemployment ever and overseas turmoil. His best campaign strategy, his best fund-raising tool should be to sit down and do the damn job we hired him to do!
Looks like Veronica de Rugy liked your graph. (http://mercatus.org/publication/how-many-jobs-gained-during-presidential-tenure) Great minds must think pretty similarly though; from her post one might believe she arrived at the idea to create her graph totally independently.
When Obama’s advocates cite jobs created these days, they are generally speaking of the 27 months since that nadir of jobs in 2009. It’s a very creative means of lying.
The economy shed about 5 million jobs in this eternal recession/downturn and Obama and the Democrats have only created their claimed 4.3 million new jobs, then they remain about half-a-million in the hole. Apparently the numbers you are using yield different, but similar results.
I’m not going to argue with you . . . you’ve done the work, I’ve only read it.
Great analysis, wish I had seen it sooner.
No, actually private sector jobs increased under Bush and far more than under Obama.
http://factcheck.org/2012/06/obamas-economic-sleight-of-hand/
Many of us over at the Rutherford Lawson blog are interested in these job numbers. The host has dismissed out of hand these numbers claiming you have basically falsified your data. If you should have any desire many of us would love nothing better than to hear an explanation of these numbers. https://rutherfordl.wordpress.com/
I just found your site a few days ago and so far I am a big fan. Thanks for taking the time to throw this all together.
Unfortunately Noah has mischaracterized my position. I did not say you falsified the data since the data does come from reliable BLS charts.
What I said was that your explanation of your methodology was flawed and therefore either you made a mistake in your explanation or you were simply full of baloney.
After examining the explanation of the BLS charts I have come to the conclusion that you wrote “undercount” in your analysis when you meant to write “overcount”.
If that is the case, you don’t owe me any further explanation.
Specifically, I wrote the following most recently in the blog discussion of your analysis on my web site:
The one thing I caught here that I missed before is that Table B potentially double counts people if they worked for two different companies in the survey period.
This makes the following comment by PolMath totally nonsensical:
“I’m using the Employment table from the BLS A Tables. This is not the one that most Obama proponents prefer to use. They prefer using the BLS B Tables because they give numbers that are kinder to Obama. But the B Tables UNDERCOUNT employment (they only count payrolls) and everyone knows this.” Emphasis mine.
He’s right about why Obama would like Table B because it OVERCOUNTS employment, not undercounts employment as he wrote in his analysis.
I think we’ve settled the matter. PolMath using Table A does hurt Obama’s numbers and is probably a more valid approach that avoids the potential dups in Table B. PolMath’s only problem is he wrote the wrong thing when he described his methodology.
so can you compare the one or less term presidents? george hw bush one term.. ford less than one term… carter one term… jfk less than one term… can you compare those presidents? dont throw the baby out with the bath water… this goes back to 48 you can use your own brain to decide whether the two termers are fair or not or in the basis of nixon one term and 9 months…
this is a comparison of all presidents since 48 including two term presidents, slightly over 1 term president 1 term presidents and under one term presidents in the case of jfk and ford.
its a well rounded comparison through all lengths of office…
Because he only has netted 300k jobs. He lost 4 million since he’s started but those were gained back since. So that’s why they say 4.3 but really it’s only 300k. And of the 300k, they say they’re not the same jobs that returned.
Dear politicalmath, PLEASE comment at IJ Review or via email on why George W. Bush’s average unemployment rate isn’t 5.3%, as I’ve seen reported in dozens of places.
http://www.ijreview.com/2012/09/15381-the-chart-obamas-employment-record-in-one-glance/
Thanks much, and keep up the great work.
Interesting … Just noticed both Bushes left office with unemployment at 7.5% (according to this chart.) That means that’s the starting point for Clinton and Obama, yet Clinton is the biggest job creator and Obama is the worst. Clinton was 100 times better, which certainly can’t be made up by just being in there 2x longer. Is this a fair comparison to make?
Unemployment was already up to 7.8% in adjusted numbers when Bush left office/Obama took office. I’d like to know where the author came up with the 7.5% number.
Unemployment numbers, jobs numbers and rates are based on surveys taken the week the contains the 12th day of the month. As a result, all jobs numbers, numbers of people employed, the unemployment rate, etc., for January 2009 belong in the Bush column. The unemployment rate was 7.8% adjusted, 8.5% unadjusted in January 2009.
Now, the unemployment rate for February 2009, which includes layoffs from the week of January 12th through the week of January 20th, days which still fell in the Bush term, jumped up to 8.3%.
The unemployment rate when Bush I left office was 7.3% (I’m using the BLS historical table LNS14000000 and I don’t know where the author is getting these numbers.) Big difference between the economies that Clinton inherited and Obama inherited. Isn’t that obvious?
The unemployment rate that Clinton inherited was declining, and had reached a peak in July 1992. The unemployment rate that Obama inherited was rising, had been rising since late 2006/early 2007, and was rising with a bullet by the time Obama took office.
Did you really think that Obama was so great that he was going to stop the absolute free fall and start adding jobs on January 21st?
The U.S. economy is like a big battleship.. they don’t turn around on a dime.
Average unemployment rates over a period of years are somewhat meaningless, don’t you think? Even annual average unemployment rates are somewhat meaningless if you are in a period of rapid economic change.
Why is that lying? Did you really think that Obama would be so great that he would immediately turn around a rapidly declining economy and start adding jobs from Day 1? After the recession of 2001 ended, it took 21 months for us to start adding jobs. After the much deeper recession of 2007 ended, it took 8 months to start adding jobs.
Using the number of people employed, as the author does on this graph, is a bit dishonest. Jobs numbers are used because they are more accurate than numbers of people employed, which is self-reported. “Employment” according to the A tables includes people who mow grass for a neighbor a few hours a week while they wait for something better to do.
They number of people employed is certainly a useful measure, but it also tends to be much more volatile than the jobs numbers and the seasonal adjustments to the A tables often seem a bit hinky to me.
Also, the economy lost a whopping 8.8 million jobs (not people employed) in this recession, 4.5 million of them before Obama stepped one foot into the White House, another 2.2 million before April 12th. I have no idea where you had the idea that we ONLY lost 5 million jobs. It was much, much worse.
1. You are right about the timing. As we were losing 800,000 jobs a month right as Obama took office, do you think that the new Prez would want to claim those losses which he had nothing to do with? Don’t you think the McCain/despicable P woman would have done the same thing if they had been elected?
We bottomed out in terms of jobs in February 2010. We bottomed out in terms of employment in December 2009.
2. I’m not sure what you mean by “net/gross”. I use “gross” to represent an absolute number of people laid off or people hired, such as reported in the weekly unemployment claims reports. I use “net” to represent a number after all additions and subtractions have been made. The monthly jobs numbers are net number.
As I said, the jobs numbers are net numbers, representing jobs added after all jobs have been subtracted or vice verse. We had more jobs (or people employed) added than jobs (or people employed) lost. When Obama was inaugurated in January 2009, 142,187,000 people said they were employed (in seasonally adjusted numbers). In May 2012, when the above was written, 142,287,000 claimed that they were employed. That’s an increase of 100,000 people working. Remember that we went down to only 137,968,000 people working in December 2009.
There is a big difference between numbers in Mass under Mitt and numbers for Obama: Mitt took office during a time of national recovery after a much lighter recession (In the 2001 recession, we lost about .4% of our GDP; in the 2007-2009 recession, we lost over 5% of our GDP. We were out of recession and starting recovery when Mitt won Mass, and we were still in recession when Obama took office.
Despite the recovery, the unemployment rate for Mass under Mitt, usually quite a bit below that of the U.S. as a whole, jumped up to equal and above that of the U.S. as a whole. After Mitt left office, it fell back to its usual spot below the unemployment rate of the U.S. as a whole, where it remained throughout the economic downturn.
So.. if employment is a concern, you need to look at Mass under Mitt. Not a particularly pretty sight.
No.. It is from February 2010, when the number of jobs bottomed out.
“They say they are not the same jobs that returned”.. Can you explain that statement?
If you mean they are NET jobs; the number of jobs after all job losses are subtracted from all growth, you would be correct.
Actually, the housing bubble had already burst in summer/fall 2006. Housing starts and jobs in some sectors, like construction, had already peaked. There were two reasons the Dems won back Congress in 2006: 1. The unending wars; 2. The burst of the housing bubble and economic storm clouds on the horizon. Many pundits were saying we were heading into a steep recession in 2006, before the election.
No, you can’t and you shouldn’t.
You should compare job loss and growth either by presidential term, per month, or per year.
We’ve lost government jobs. We’ve lost over 600,000 government jobs, mostly in the “local government – education” sector. 300,000 teachers gone. Great.
Can you refresh this through August… or wait until the end of September?
Obama has created more private sector jobs. Bush created more public sector jobs. Republican administrations across the nation have been firing teachers and other public employees like crazy, so that offsets Obama’s gains.
of course like your web site but you have to take a look at the spelling on several of your posts. A number of them are rife with spelling problems and I find it very troublesome to tell the reality on the other hand I’ll certainly come back again.
The graph is real and helpful. The argument, pro or con toward Obama lies in this: Is he responsible for the almost 4 million jobs lost in the first year of his Presidency, or is Bush. We all know that the budgets are always done a year in advance. So, in reality, the graph would be better if it showed job growth from one year after each President took office and included for one year after they left. This would then show the last Bush having a horrible second term. And Obama having a healthy first term. I think this is more accurate and more truthful and can be done comparing each President on the same basis.
Thank you for this great article. I used your graphic on my blog, http://www.ladypatriotus.blogspot.com. I tire of the Obama cult preaching of the great things Obama has done with job creation and the economy. Granted, Obama did come into a mess, but he has also left us with many pathetically failed policies. What the cult members see is his policies, not that they failed miserably.
I believe that is one of the so much important info for me. And i’m glad reading your article. However want to observation on some general issues, The site taste is ideal, the articles is in point of fact great : D. Just right process, cheers